
Home
A comprehensive resource for safe and responsible laser use
US: Why did lasers aimed at aircraft increase after the 2020 election?
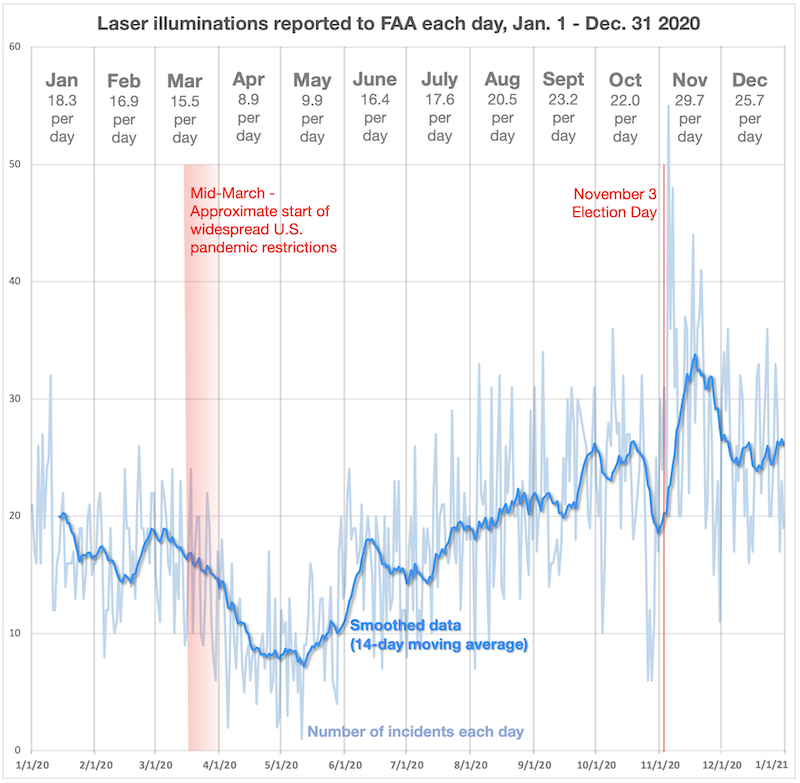
In fact, of the 10 highest days (most incidents) in 2020, all but one occurred in the Nov. 5-21 period. There were 55 incidents on Nov. 5, 48 on Nov. 6, 44 on Nov. 17, and 41 on Nov. 21. These occurred more than twice as often, compared with the 2020 average of 18.7 incidents per day.
Is this a statistical anomaly or did the disputed election results somehow lead to an increase in laser incidents?
COMMENTARY AND ANALYSIS BY LASERPOINTERSAFETY.COM
The chart below indicates that the three previous U.S. presidential elections did not have an effect on lasing incident rates.
It shows that in 2008, 2012, and 2016 the number of laser incidents each day between October 1 and Dec. 31 rose smoothly and steadily. In contrast, the lasing rate in 2020 (black line) slowed substantially around October 26, and rose significantly just after Election Day on November 3.
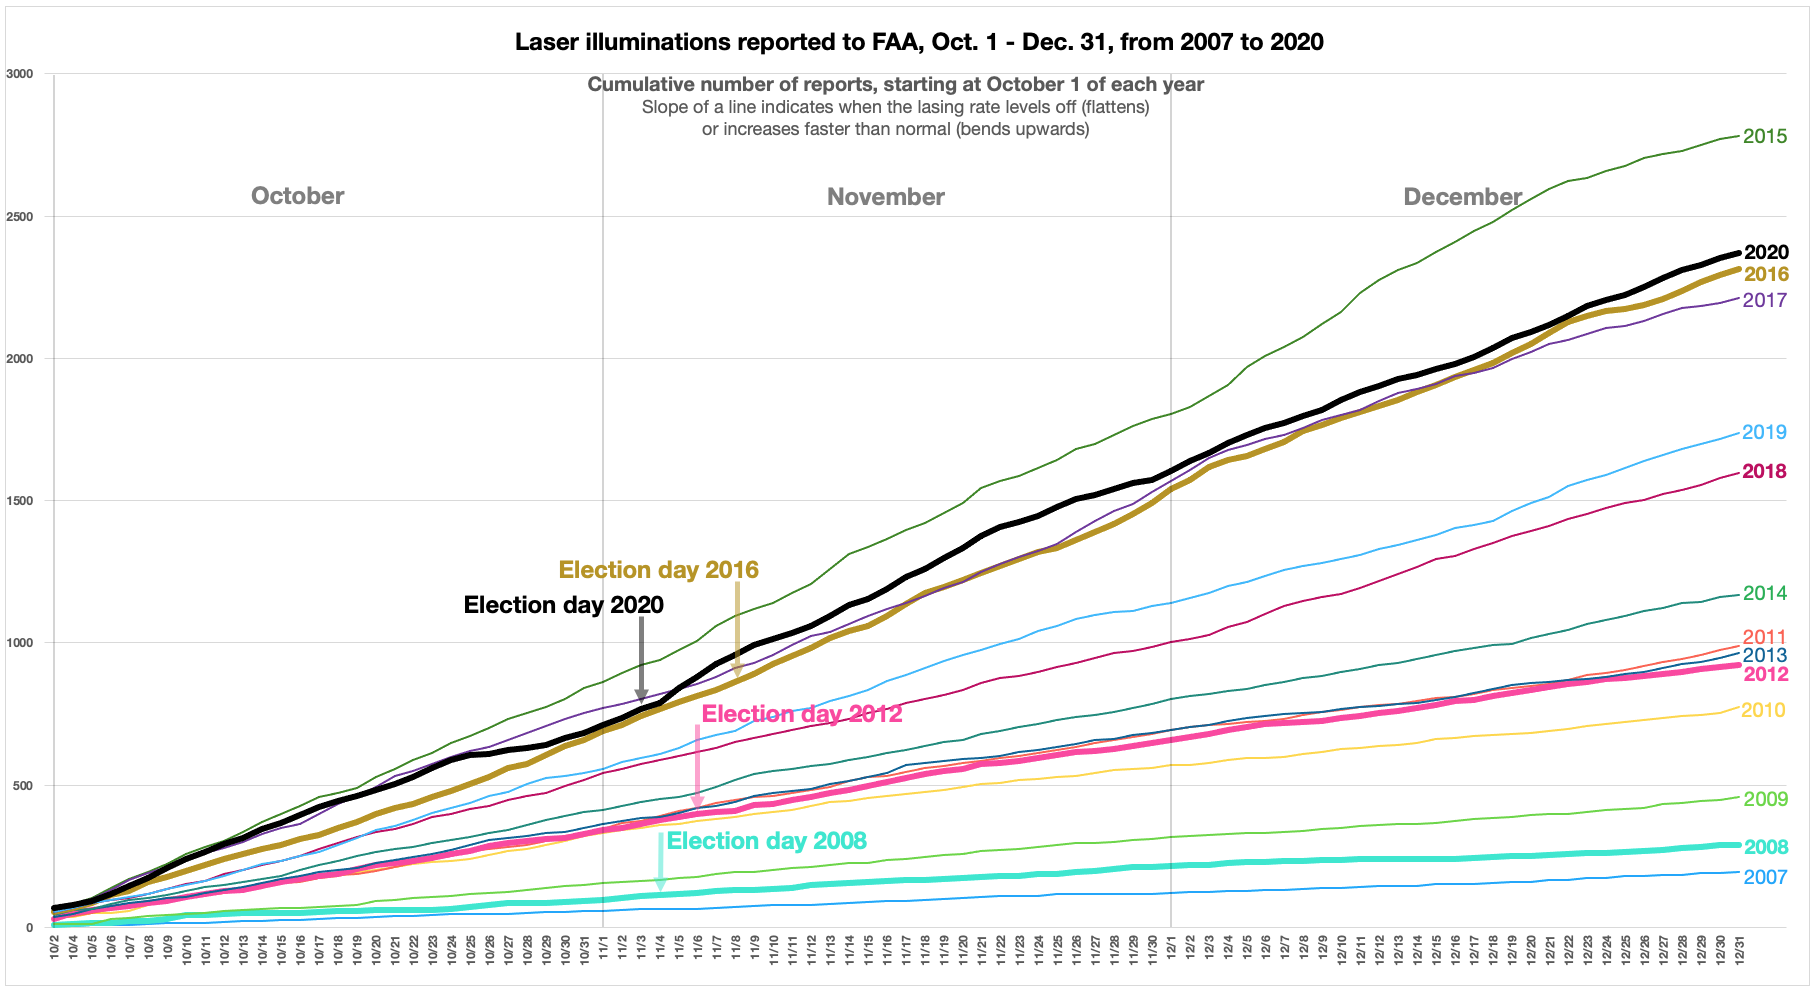
However, these two effects appear to counter each other. It may be that some other factor, such as how FAA records or processes laser incident reports, slowed in late October and sped back up in November.
In summary, while it is tempting to say that agitation over the 2020 election results led to an increase in persons aiming lasers at aircraft, this was not seen in previous election years and may be a statistical anomaly.
The chart above shows how fast laser incidents increased during October through December, for the years 2007 through 2020. Each line starts on the left with 0 events on September 30, then each day's total of laser incidents is added to the previous total.
If there is a slow and steady increase, the line rises slowly and is relatively straight. This can be seen in the 2007 and 2008 lines.
If there is a faster increase (more laser incidents per day), the line becomes steeper, as shown by the 2014 line.
In 2020, we can see the lasing rate slows dramatically starting around October 25. The line is almost flat, indicating that few new incidents are being added. (On Oct. 26, there were only 6 reported incidents; on Oct. 27, 12; on Oct. 28, 6 again.)
But then the line rises faster starting on November 5, when the yearly high of 55 new incidents is added. It keeps rising until around the last week of November when the slope returns to a steady, relatively straight line.
Looking at the four U.S. presidential election years 2008, 2012, 2016 and 2020, the first three have steady lines with no changes around Election Day. Only the 2020 chart shows a dip before the election, and a rise afterwards.
Also, other non-election years do not show much of a change in the early November period — the lines rise steadily and smoothly.
As stated above, LaserPointerSafety.com's conclusion is that there is some other reason for the post-election jump, other than the election itself. A closer look at the raw reports that came into FAA, and how they were processed, may give some insight.