Home
A comprehensive resource for safe and responsible laser use

FAA laser/aircraft incidents: 2004-2014 historical data
Additional news articles with statistics about laser use -- for example, in countries outside the U.S. -- are here. For more information on how to find news articles on various topics, see this page.
2004-2014, total incidents
From January 1 2004 through December 31 2014, there have been over 21,500 laser/aircraft incidents reported by pilots to the U.S. Federal Aviation Administration. The chart shows how many incidents occurred each calendar year:
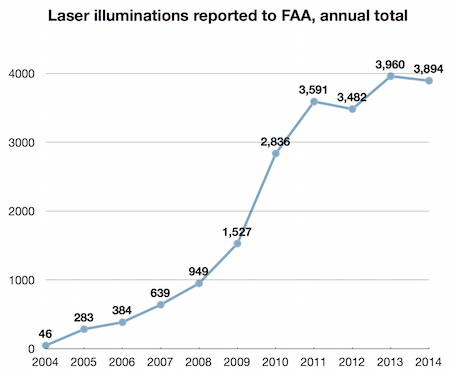
The above numbers are likely to be underreported. Although U.S. civilian pilots have been required since January 19 2005 to report any sighting of a laser beam, not all pilots take the time to fill out an FAA incident form.
2010-2014, annual news stories
Since 2010, at the end of each year LaserPointerSafety.com compiles a news item about the year’s FAA statistics. Here are links to the stories for 2014, 2013, 2012, 2011, and 2010.
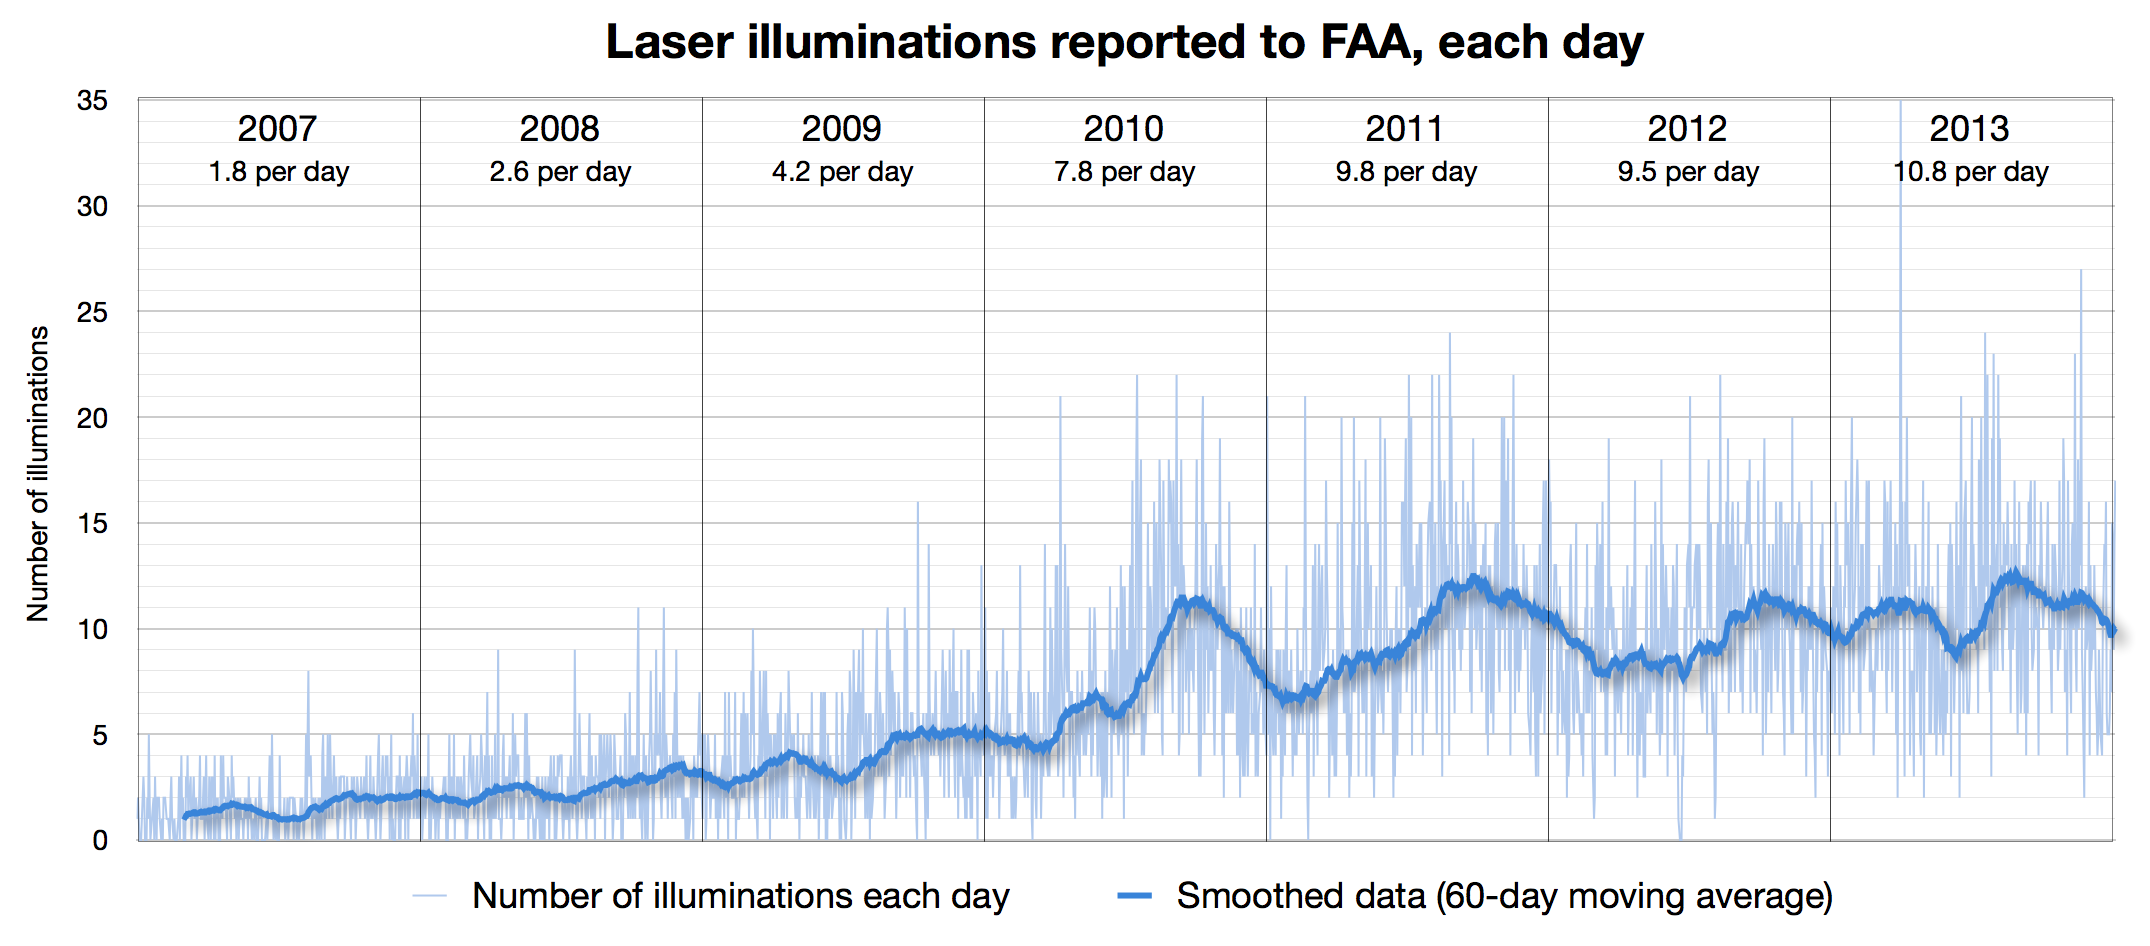
2007-2014, incidents every day
In the chart below, the light blue line shows the number of incidents for every single day. Each vertical line represents one day’s worth of incidents. A wide variability can be seen day-to-day. (The tallest line is for March 29 2013, when there were 35 reported incidents -- significantly more than previous high points. On that day, one city had a cluster of nine laser incidents in two hours; another city had five incidents in 30 minutes.)
The dark blue line shows the average number of incidents in the previous 60 days. This is done to help smooth out the data and give a better indication of overall trends.
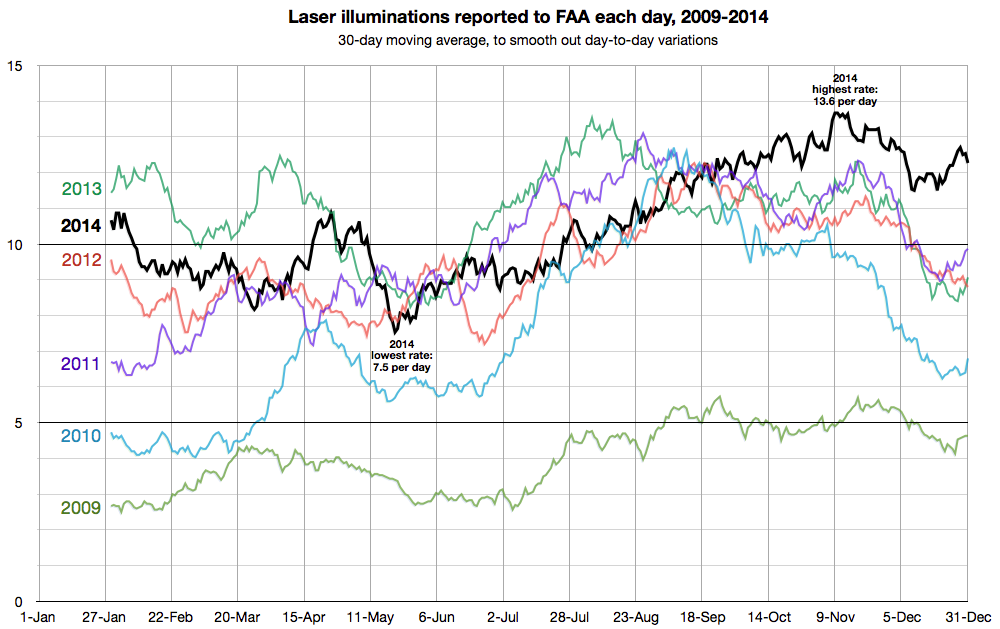
2009-2014, incidents every day
The data above, for the period 2009-2014, is rearranged below. Instead of each year’s data following the next, the data is overlaid. This makes it easier to see seasonal variations within a year, as well as trends. For example, the last four months of 2011, 2012 and 2013 have had roughly the same number of illuminations.
Each line shows the average number of incidents in the previous 30 days. This is done to help smooth out the data and give a better indication of overall trends.