Home
A comprehensive resource for safe and responsible laser use
US: FAA webpage analyzes laser strike statistics
It includes graphs of yearly, monthly and daily laser event numbers, data on events by month and by day of the week, states ranked by raw numbers and on a per capita basis, injuries, and altitudes at which lasers were seen. By clicking on data points or sections of a chart, a box pops up with more precise information.
Here is the top part of the webpage as it appeared in September 2021:
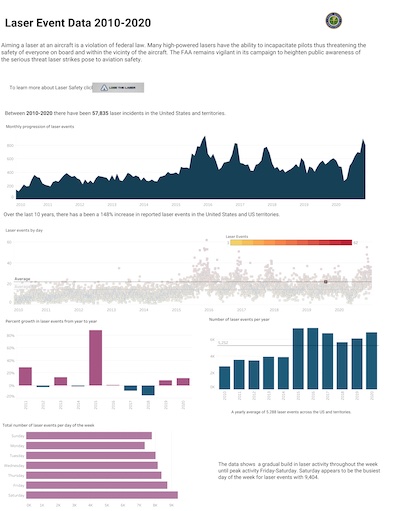
From FAA's data visualization webpage. If this link does not work, the data might also be accessed from FAA's main laser safety webpage. T
COMMENTARY FROM LASERPOINTERSAFETY.COM
Many of the FAA charts on the webpage are very interesting, such as the number of laser events per capita for each state. For example, Hawaii leads the country in laser illuminations per capita, in 2020.
However, some charts are near useless such as the "injuries" chart. This is organized by state, not by type of injury. Worse, there is no information provided about what counts as an injury, or the severity and outcome of the reported injury. (We have our own injury analysis chart on this page which is much more detailed.)
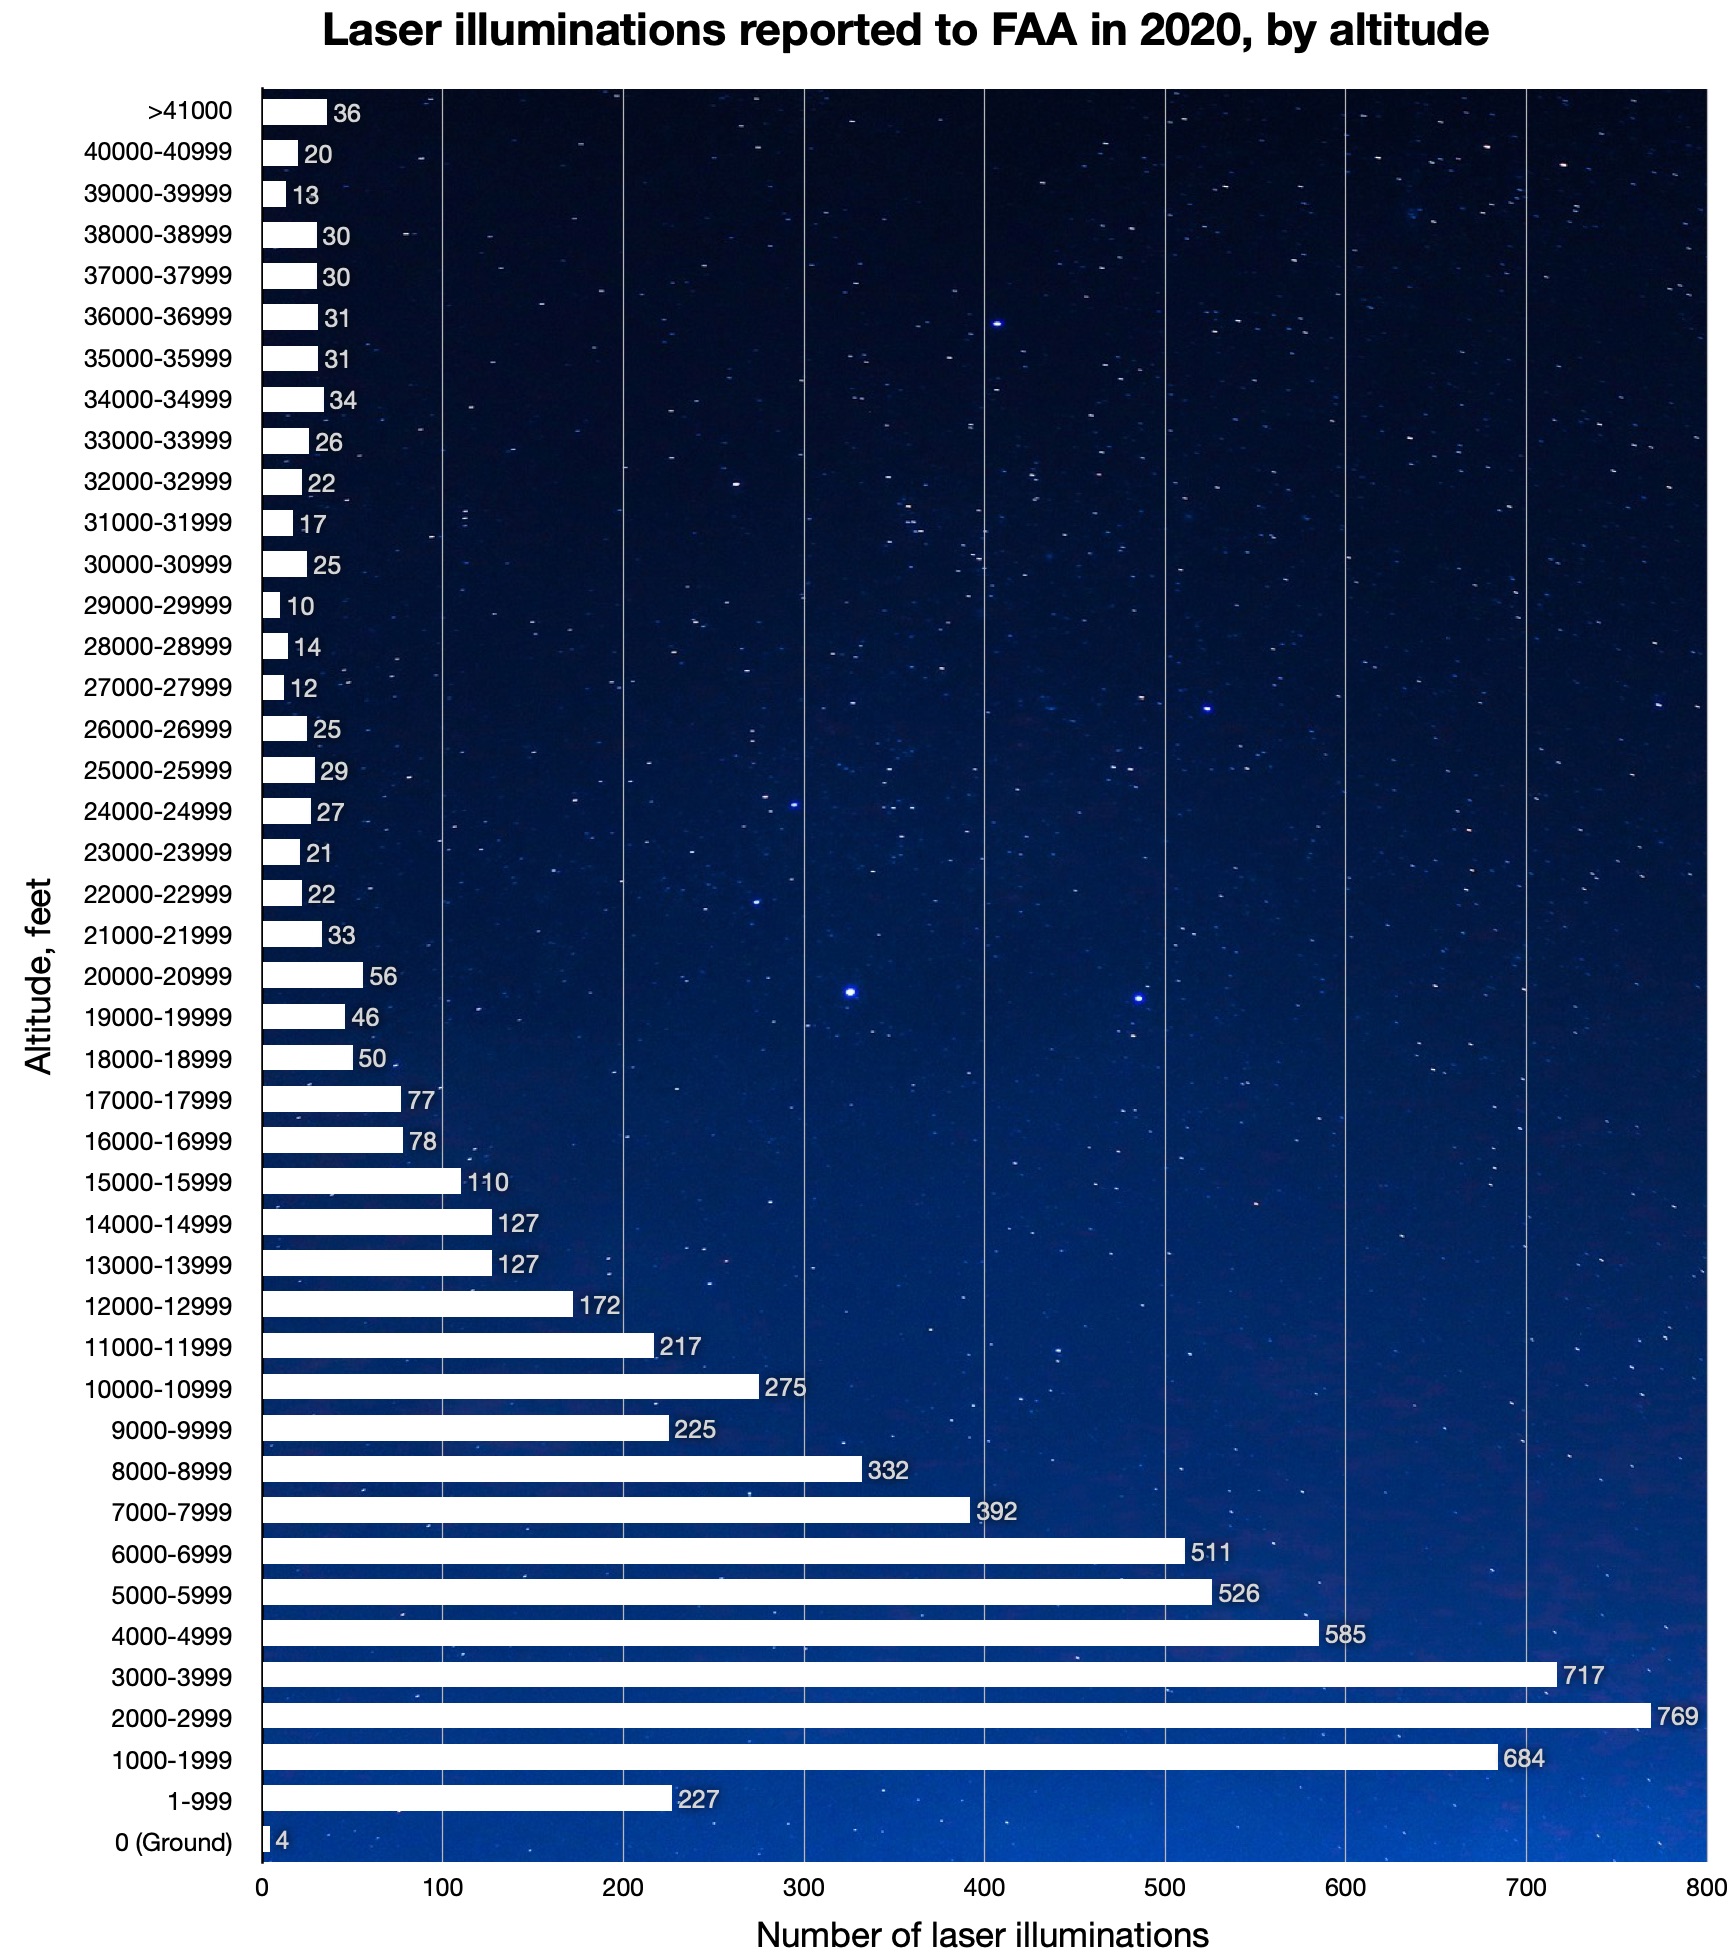
Another near-useless FAA chart is one that shows aircraft altitude during the incident. The chart shows data points with the number of flights at a given altitude. But there is no attempt to group altitude ranges together, for example, to find out how many laser incidents happened between 0-1000 ft, between 1000-2000 ft, etc. 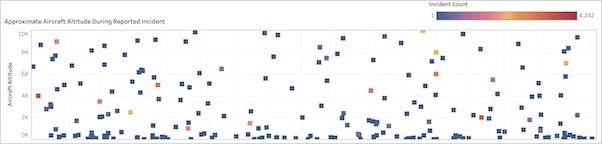
In contrast, this chart (done by LaserPointerSafety.com) has the same data formatted in a more understandable way: