Home
A comprehensive resource for safe and responsible laser use
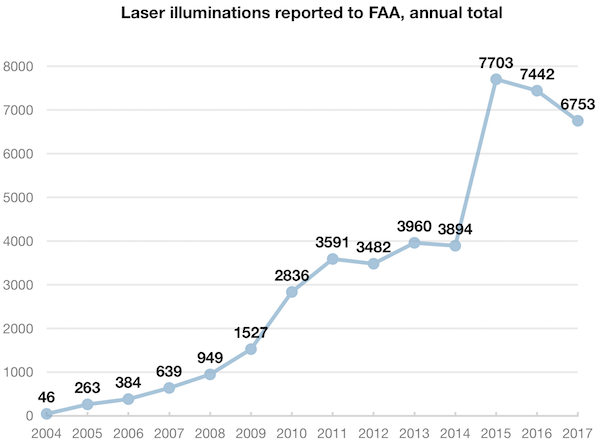
US: UPDATED - 6,753 laser/aircraft incidents reported to FAA in 2017; 9% lower than 2016
During 2017, there were 6,753 laser illumination incidents reported to the U.S. Federal Aviation Administration. This compares with 7,442 reports in 2016, and 7,703 reports in 2015. This is a 9% drop compared with 2016, and a 12% drop compared with 2015.
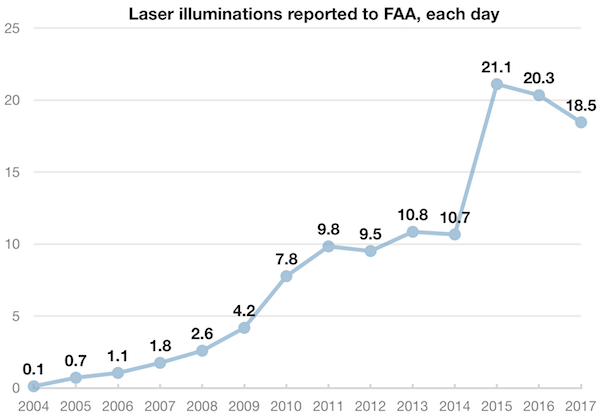
Here is the same data, plotted to show the average number of illuminations per day, during each year:
For additional charts and statistics, click the “read more” link.
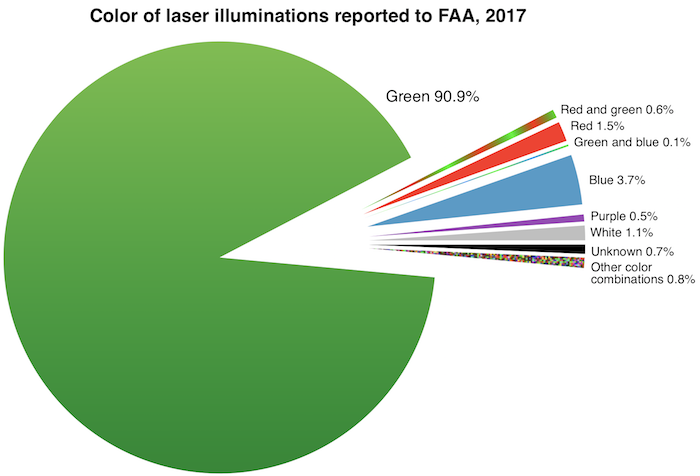
There were about 33 reports where the laser was known or suspected to come from “Christmas” or “holiday” lights. This represents 0.5% of all 2017 laser reports. Despite the proliferation of holiday laser lights, the proportion of “red and green” laser sightings was the same in 2017 as in 2016: 0.6%.
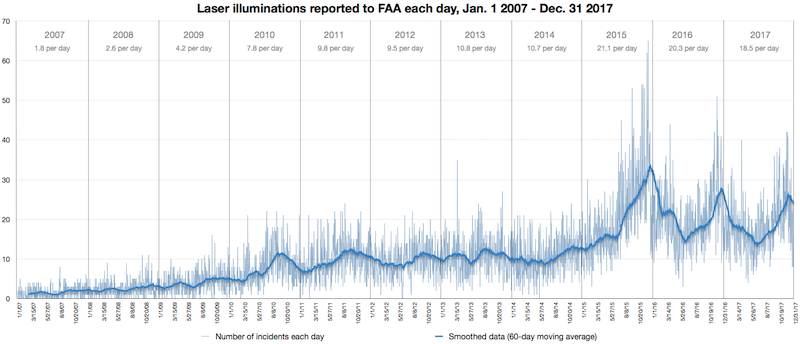
The chart below shows the number of laser illuminations for every single day from 2007 through 2017. The light blue line shows each day’s illumination reports. This number can vary widely from one day to the next. The dark blue line is a 60-day moving average; this helps smooth out the data in order to show longer-term trends.
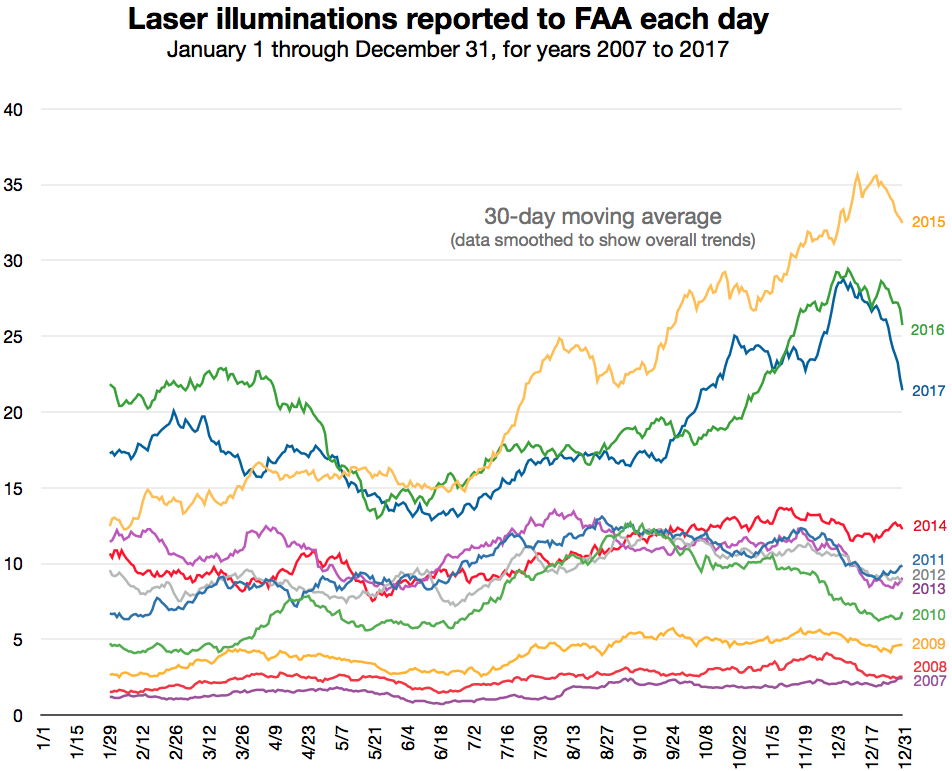
Here is the same data, except that each year is superimposed in a different color. This makes it easier to see how laser illuminations vary throughout each year. (Note that January is not shown because the data is a 30-day moving average, so the plotting starts with Jan. 31. Also note that because of the 30-day averaging, the maximum number of laser illuminations in a day appears to be about 36, when as shown by the chart above, the maximum number on any one day was 65.)
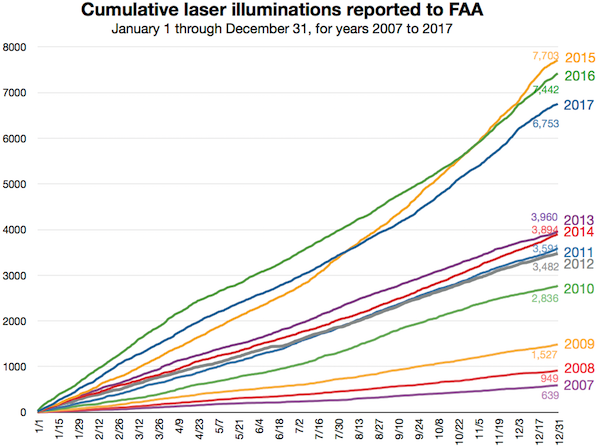
Yet another way to look at trends within a year is to view the cumulative number of laser illuminations. Each year starts with 0 illuminations, then rises to the yearly maximum on Dec. 31. For example, you can see that in 2017 and 2016, there were more incidents early in the year and fewer later in the year, compared with 2015. In all years except 2015, the lasing rate was relatively steady — the number of incidents is more-or-less continuously rising throughout a year.